Online revenue grew by an average of just 1 percent last year, down from 23 percent growth in 2017 and the first time in 13 years of the M+R Benchmarks Study that growth was in the single digits. The 71-page report, released today, analyzed 4.4 million emails sent to 37.5 million email addresses, more than 7 million online gifts and $376 million raised by 135 nonprofits.
“What we saw was a really extraordinary spike in 2017. That growth was not able to be maintained but we didn’t lose any ground either,” said Will Valverde, creative director at consulting firm M+R. “One way to think about it: 2018 growth just showed up a year earlier,” he said, looking over the past five years of data. There were probably lots of things that impacted the flat online revenue growth, Valverde said, and not just one simple explanation. It could have been the political reaction to the 2016 election, changing donor behaviors in light of new tax laws, or other factors.
“It’s a surprise in a sense because we never reported a number like that. Every other time, we’ve reported double-digit growth,” Valverde said. “For those of us who’ve been fundraising day after day through 2018, after end-of-year that a lot of nonprofits had, with December not meeting expectations for lots of groups, it’s not a shock,” he said. What helped to stabilize online revenue in 2018 was the steady expansion of monthly giving revenue, according to Valverde, which increased 17 percent. Also a key element in 2018 figures was online donor retention.
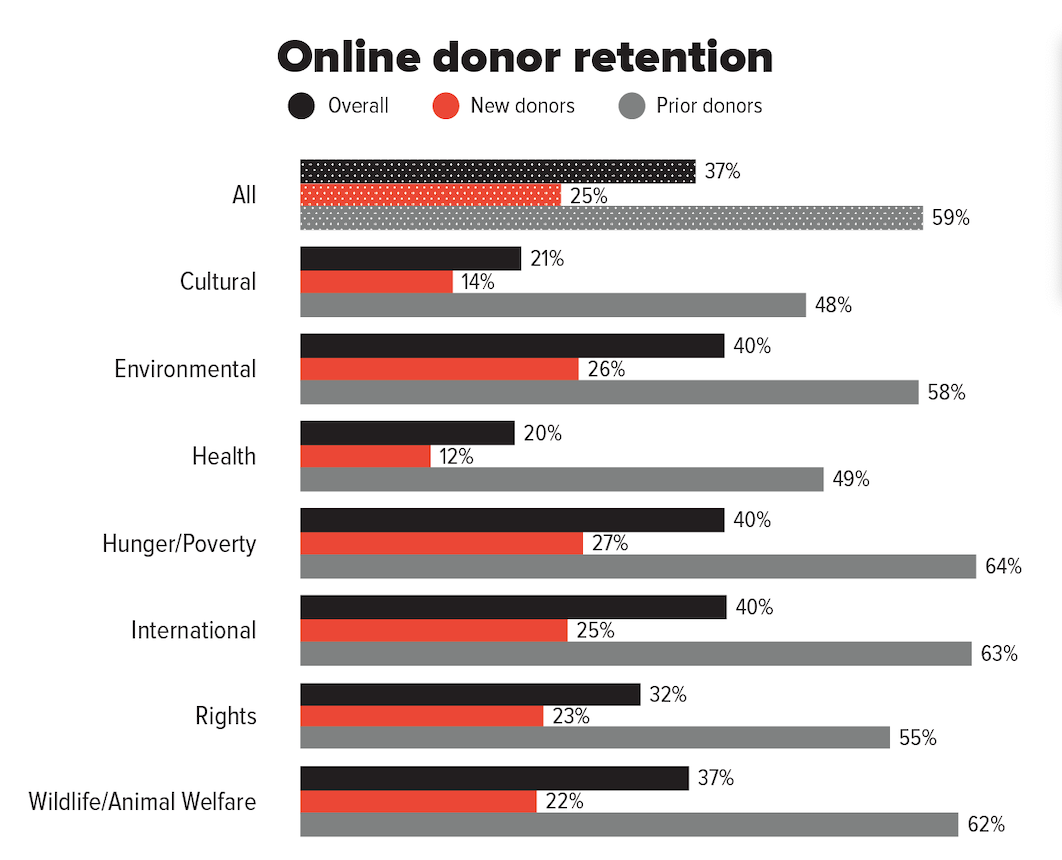
Overall, 37 percent of donors who made a gift online in 2017 donated online again to that nonprofit in 2018, about 3 percent less than in 2017. Only one in four new donors who made their first online gift in 2017 repeated the gift, compared with prior online donors whose retention rate was 59 percent. This year’s study also looked at the distribution of donors and revenue by donor level.
Donors who gave at least $250 accounted for 17 percent of all gifts during 2018 and 57 percent of revenue, according to the study. Only 10 percent of donors who made gifts of less than $25 in 2017 gave again in 2018, according to the report. Retention rates increased as the size of gifts increased, peaking with donors in the $250 to $499 range who had a retention rate of 54 percent. Again, monthly giving had a hand in boosting those numbers as well. The average one-time gift was $123, compared to the average monthly gift of $23, which would work out to $276 over 12 months.
Email revenue decreased by 8 percent but still accounted for 13 percent of all online giving. For every 1,000 email appeals sent, nonprofits raised an average of $45. Email lists still saw growth, up 5 percent, with nonprofits sending 4 percent more fundraising emails than in 2017, with 14 percent churn.
Open rates were 15 percent, down 4 percent since 2017. Response rates were down even more, 13 percent for fundraising emails to 0.06 percent, and 15 percent for advocacy emails, to 1.8 percent. For the first time, the study analyzed almost 33,000 unique Facebook Fundraisers. The vast majority of Facebook revenue in 2018 was via Facebook Fundraisers, a peer-to-peer tool that exploded last year, accounting for 99 percent of all nonprofit revenue processed on Facebook. For every $100 in direct online revenue, nonprofits raised an additional $1.77 via Facebook.
Health nonprofits in particular took advantage of Facebook Fundraisers, receiving $29.88 via the tool for every $100 received in direct online revenue, far ahead of other categories. The average gift for health nonprofits was $37 and the number of Facebook Fundraisers per organization was highest, by far, at 690. Three of the seven subsectors averaged more than 100, with the next closest being rights groups at 132.
The average number of gifts to an individual Facebook Fundraiser was 7.4, the only outlier there were rights groups, at an average of 9.5. Almost one quarter of the revenue raised via Facebook was during November, likely due to #GivingTuesday. Otherwise, the percent of Facebook-related revenue raised in each month ranged from 5.17 percent to 8.51 percent.
When it came to social media, for every 1,000 email subscribers, the average nonprofit in the study had:
- 806 Facebook fans, up 6 percent;
- 286 Twitter followers, up 26 percent; and,
- 101 Instagram followers, up 34 percent.
Also for the first time, the study examined membership and ticket revenue, which saw a pretty significant shift toward online than the previous year, Valverde said.
“Membership giving followed a similar trajectory to other kinds of online revenue. After robust 21 percent growth in 2017, nonprofits saw a 5 percent increase in membership revenue in 2018,” according to the report.