The Nashville, Tenn.-based nonprofit made it through the recession, even building up a million-dollar reserve. It was rebranded in February as Mental Health America of the MidSouth (MHAMS). About a year ago, three employees left to work for a local domestic violence organization, prompting Starling to call the CEO there and ask what was up. It turned out the other nonprofit had six of its own employees recruited away by another local charity focused on sexual assault.
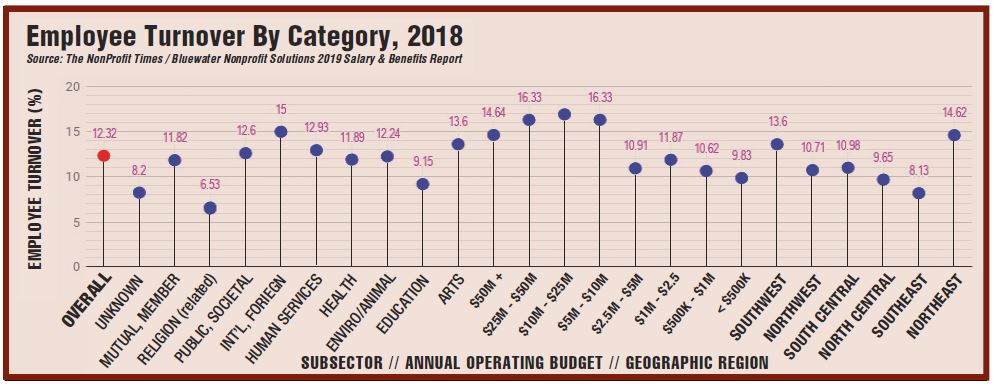
The challenges faced by nonprofits are much different than they were a decade ago, perhaps most prominent being staff turnover. Employee turnover averaged more than 12 percent last year, according to the 2019 Nonprofit Organizations Salary & Benefits Report from The Non- Profit Times and Bluewater Nonprofit Solutions. That figure has steadily grown since the start of the decade, as the economy rebounded from the Great Recession.
In the wake of the Great Recession, average staff turnover in the 2009 Salary & Benefits Report spiked to 14.54 percent before mellowing out at 9.1 percent in 2010. The average turnover rate has steadily grown each year since, topping 12 percent in 2017, at 12.23 percent, and inching up to 12.32 percent last year. Meanwhile, average salary increases for staff have been relatively consistent, ranging from 2 to 3.5 percent.
Turnover has tended to be lowest at the smallest organizations. Last year, organizations with budgets of less than $500,000 reported average turnover of 9.83 percent — the only category that did not break 10 percent. The average crept toward 10 and 11 percent at larger organizations, up to about 16 percent for those with budgets of between $5 million and $50 million. At nonprofits with budgets of $50 million or more, the average turnover rate dipped below 15 percent.
The exodus was painful, Starling conceded, but it also provided the $2-million organization with an opportunity to examine how it might redistribute job responsibilities. He and his board not only filled the three vacancies but also added four more staff — quite a commitment considering there had been about 10 full-time staff, down from 24 after the recession; now there are 19 staffers.
“We decided to just bite the bullet and this fiscal year make all employees full-time, with full-time benefits,” he said. During the past two decades the only full-time positions were in leadership. Most program staff typically were part-time.

This year will be the second financial shortfall in 10 years, Starling said, but “we believe we’re doing the right thing and the funding and revenue will all come if we’re true to our mission.” He credits his board chair for much of the insight into the changes, providing an analogy for the reorganization. “As a family, you’re never financially ready to have kids. If we don’t choose now to grow our family, with good staff and a little reserve in place, when are we ever going to be able to do this?”
Said Starling: “This upcoming fiscal year, we already have more financial commitments than ever. We’ve really let people, foundations, patrons and donors know that this is an investment year. They have come to really respect that.”
There’s more of a focus in this economy to retain employees who have other job choices with good salary and benefits, Starling said, adding that Nashville had the lowest unemployment rate in the state this past year. “We’ve noticed that with some of our bigger partners, facilities that do a lot of counseling, respite, direct services, all have to up their salaries to retain their clinical staff,” he said.
The average annual salary increase in the prior year for all staff averaged 3.16 percent, with the current year projected at about 3.07 percent, according to the Salary and Benefits Report. For executive staff, the prior year increase was slightly higher at an average 3.32 percent.
The smallest organizations had the highest average salary increases for executive staff: 3.69 percent for those with revenue of $500,000 or less and 3.59 percent for those between $1 million and $2.5 million. The only organizations with averages failing to eclipse 3 percent were those between $10 million and $25 million (2.97 percent) and the largest organizations, $50 million or more (2.18 percent).
Average cash compensation for a chief executive officer or executive director was $134,402, with a median of $113,418, according to data in the Salary and Benefits Report. The highest average was found in the Northwest, at $164,234, while the lowest average was in the Southwest, $123,391.
The lowest increase for all staff in the previous year was at the small organizations, at 1.79 percent, while all other categories surpassed 2 percent or more. The highest average increase of 4.29 percent was found at organizations with operating budgets between $1 million and $2.5 million. Those organizations also anticipated the highest current year projection for staff salary increases (3.97 percent). All categories of organizations expected average increases of no less than 2 percent for 2019.
Like at any nonprofit, Susan Davies said, the challenge is to make sure people have a living wage. “We’d love to provide full medical benefits but we can’t,” she said, instead offering a stipend encouraged to be used toward benefits. Davies is executive director of the Open Space and Trails Coalition (OSTC) in Colorado Springs, Colo., which has three full-time staff and two part-timers on a $325,000 annual operating budget.
OSTC is in the minority when it comes to medical plan offerings. Among respondents in the survey, almost 85 percent offered some kind of medical plan, with a PPO Plan being the most common, offered by two-thirds of organizations:
• Preferred Provider Organization (PPO) Plan, 66.67 percent;
• High Deductible High Plan (HDHP), 28.92 percent;
• Health Maintenance Organization (HMO) Plan, 26.1 percent;
• Point of Service (POS) Plan, 9.24 percent; and,
• Indemnity Plan, 1.2 percent.
OSTC tries to make it up in other areas, such as being extremely flexible with hours, a very liberal vacation policy and paid time off (PTO). An employee gets three weeks off in the first year, plus all federal holidays. For instance, Davies has a part-time employee who is getting married, so she’s putting in all the time she needs now before taking a three-week trip to at Christmas. “There’s nothing like that in corporate America,” Davies said.

The percentage of medical plan costs covered by a nonprofit employer varies, but some make it a point to cover 100 percent, or close to it, as a retention tool.
The Dibble Institute in Berkeley, Calif., covers 95 to 98 percent of the cost of employee healthcare plans. “We can afford it. We make room for that. We expect a lot from staff,” Executive Director Kay Reed said. Benefi ts, as well as PTO, are available immediately upon hiring. But Dibble Institute also is in the minority for covering such a large portion of medical costs.
While the 1.2 percent of organizations that offer an indemnity plan cover an average of almost 100 percent of employee medical costs, among organizations that offer a PPO plan, the average portion covered by employers is almost 82 percent. That average drops closer to 60 percent if it’s an employee + one or employee + family plan. Other options, such as HMO or POS plans, are in the same ballpark covering the percentage of healthcare.
Reed wonders how long they’ll be able to afford underwriting that much of the benefits because healthcare costs are always a challenge. “If we want to be super competitive, we would probably have to figure out a 401(k) or nonprofit equivalent but there hasn’t been a need. Working virtually is only getting easier. We’re just a different kind of nonprofit. We’re not doing direct service. We’re not place-based,” she said.
At the Woodstock School of Art in Woodstock, N.Y., Executive Director Nina Doyle also explores affordable ways to compensate employees and provide as many benefits as she can, given the operating budget of about $500,000. The school provides a contribution to a Health Savings Account (HSA) for its six-member, part-time staff.
While it’s not as expensive as New York City, a little more than 100 miles south, Doyle said that Woodstock and the Hudson Valley generally are expensive. The high cost of living is a challenge for employers when you’re thinking about salary and how to compensate employees, she said.
Turnover has been pretty stable, Doyle said, and she’s been trying to stay ahead of state-mandated minimum wage increases, with both incremental increases in number of hours and hourly pay rates.
New York State’s minimum wage rose from $9.70 per hour at the end of 2016 to $11.10 by the end of 2018. By the end of this year, it will be $11.80 before capping out at $12.50 upstate by the end of 2020. In New York City, Westchester County and Long Island, it will be capped at $15 per hour by the end of this year for organizations with 10 or fewer employees.
“We’ve built in a plan to make sure we’re always ahead of the increases,” Doyle said. “Hopefully, it won’t be a challenge. We’re diversifying funding sources, trying to leverage support from private foundations, government grants, donations and tuition to meet expenses,” she said. “Just looking again for innovative ways to compensate staff — that’s my primary goal over the next couple of years,” Doyle said, to streamline offerings, using PTO, holidays and other ways to make sure staff are receiving competitive compensation.
Nonprofits from across the nation responded to the 2019 Nonprofit Organizations Salary and Benefits Report, providing detailed information on benefit practices and compensation data on 195 nonprofit positions. Almost half of respondents (44 percent) had between 1 and 10 full-time employees, and slightly more (48 percent) were located in the Northeast region, comprised of 11 states as far south as Maryland and Pennsylvania.
Human services organizations made up 41 percent of respondents. The range of operating budgets varied more widely, with about a quarter of nonprofits between $1 million and $2.5 million. Almost three-quarters of respondents were included within four categories of operating budgets of less than $5 million.

