Planned Parenthood of the Great Northwest (PPGNW) wanted to show condom usage. Its solution was to have 15,000 people share information most people keep to themselves. The Seattle, Wash.-based PPGNW distributed approximately 60,000 condoms with quick response (QR) codes attached in February 2012. Users were asked to check in with the location of activity and other data, such as age and relationship status of the partners. The check-ins went onto an interactive map on the website WhereDidYouWearIt.com
Approximately 15,000 people checked in, but “far and away the most popular feature is the map” with about 280,000 visitors since February 2012, said Nathan Engebretson, PPGNW’s new media coordinator. “The vast majority of people are not creating a check-in,” he said. “That’s great. One of the goals was to show how common condom use was and rely on user-generated data. People have a lot of fun on the map even if they never check in.”
Interactive maps and geographic information systems (GIS) can help your constituents visualize abstract data. Maps can show the location of client organizations if you’re a regional association, or can show donors where organizations are putting their gifts to work.
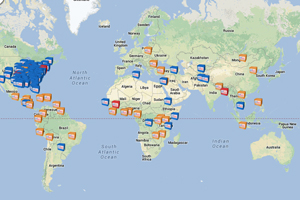
AmeriCares recently launched an interactive world map as part of a website redesign that shows where the Stamford, Conn.-based charity is sending medical supplies and emergency aid. Pins on the map show the type of aid, the ship date and the cost of the shipment.
“Our staff uses it to reference information. Our donors are more and more interested in transparency. They want to see what you’re doing with the donations and proof of where the money is going and what it’s accomplishing,” said Ted Davis, web director. “We’re trying to provide as much information as possible so people can engage with our work on the ground.”
The AmeriCares map and new website were in development for about a year before they launched, but Where Did You Wear It launched much sooner: about two weeks from idea to completion, said Engebretson. PPGNW required a high degree of customization. It wanted to include “the ability to create a unique check-in so it’s not just pins that don’t mean anything,” said Engebretson. “We wanted to create some ways to personalize it, but balance it with the need to create anonymity.”
If a user put in an address, the map would create a check-in spot plus or minus 1,000 feet from the submitted address. “Another thing we did was limited the ability to move in. People can look at neighborhoods and general areas but can’t get a street view,” said Engebretson. Even if someone were to enter an address, it wouldn’t be stored in the map’s database. Only the randomly generated data is stored, he added.
Engebretson said the QR codes on the condom wrappers simply brought users to the map. They could let their smartphones’ location services provide the map with a base location (which would then be randomized) or could manually enter the location, along with all other information.
AmeriCares also recognized the need for privacy on its map. “In some cases there are security concerns, so we are less precise,” said Davis. “In Syria we have an incredibly complicated operation. In Darfur, the same is true. We try very hard to protect our personnel and operations, but at the same time maintain a level of visibility that doesn’t interfere with our work.”
Davis said the biggest challenge was getting the data from the databases onto the map. “There are multiple data streams going in: programmatic information, news story information, primary care information, locations of facilities, shipments, emergency responses and recovery,” Davis said. “It’s all part of the map architecture.”
Food and Water Watch (FWW) in Washington, D.C., needed to help constituents visualize data, namely the locations and concentration of large factory farms. “On the issue of factory farms, one of the biggest challenges in educating the public is that (the farms are) in rural communities where most people don’t live,” said Assistant Director Patty Lovera.
A map was the perfect tool to help visualize where factory farms are clustered because of “the power of the visual,” she said. “There’s so much information to present, and a map is the easiest way to put a lot of the information out there.” The map allows users to click on a state and then a county to find out how many farm animals are in that county. The map is color-coded according to animal density, with the darkest red denoting the most “extreme” levels.
FWW launched a factory farm map in 2006, and relaunched it with new data in 2010. Lovera said it was difficult to implement the map from a programmatic standpoint. “In this field, one of the big frustrations is a lot of secrecy and lack of transparency,” she said. FWW relies on USDA’s agriculture census data, which comes out every five years.
According to David Charlton, chief operations officer for New Signature, the Washington, D.C.-based software firm that built FWW’s Factory Farm Map, the underlying architecture is based on the popular content management system WordPress. Most maps were done in Adobe Flash until fairly recently, but “HTML 5 has wider penetration now, which has made it easier for us to create code that works on multiple browsers,” said Charlton. It also allowed New Signature to show density in neighboring states while the user is zoomed into the county level of the map, something Charlton said was unavailable with Flash.
The price for an interactive map depends heavily on functionality and the amount of data. Charlton called FWW’s map “a labor of love,” but said, “If we were starting something of this nature now, it would probably be in the $40,000 to $60,000 range.” A bare-bones map with a minimum of data and capabilities “probably starts at $20,000 and can go way up from there,” he said.
Inspired by Google’s Summer of Code program, which connected young programmers with open source projects, Azavea, a B Corporation in Philadelphia, Pa., chose winners in May for its second Summer of Maps project. Summer of Maps grants $5,000 fellowships to three students in the field of geographic information systems to work on two data visualization projects each for nonprofits.
“We could take work we were doing with our data services team and extend (the work) to many more (users),” said Azavea President and CEO Robert Cheetham. First, Azavea solicited project ideas from nonprofits. The nonprofits had to already have had the data in-hand. Approximately 80 percent of GIS work is gathering data, he said. Azavea was mostly seeking nonprofits that otherwise would not have the resources for a GIS project. The company called for and received applications from dozens of students and chose three students for the fellowship.
The students will “learn about project management, presentation skills, etc.,” while they are living and working in Philadelphia over the summer, said Cheetham. “It’s not just that we hand out a fellowship. We provide space in the office, software, and a staff mentor. We treat it as a professional project.”
The Greater Philadelphia Coalition Against Hunger’s (Coalition) project was one of the six chosen. “We have really great data on who we serve and a decent sense of where the need is,” said Interim Executive Director Julie Zaebst. “We wanted to see that spatially to guide us to those in need. It’s a great way for us to get a handle on who we are and are not serving.”
In addition to identifying communities underserved by the Coalition, the map will help with the group’s publicity campaign on Philadelphia’s public transportation system. “We will be overlaying (outreach) data over the public transit maps, which will help us target underserved communities,” said Zaebst.
The Coalition already has an interactive map on its website, which shows hunger and food insecurity for every county in Pennsylvania. Zaebst said it whetted the Coalition’s appetite for visualization tools. The outreach data, she said, would not be as helpful to her staff in a less visual medium, such as a report.
“Having a visual aid makes (the data) more tangible and gives us a sense of how to think and work differently,” she said. “Less tangible ways of looking at the data are not as helpful as seeing it on a map and saying, ‘I know this area, I know who lives there and we haven’t done as well connecting to families in need.’” NPT