Staffers at the Foundation Center held their breath for a few days in 2013, when the organization released its annual report for the fiscal year 2012. That year the New York City-based organization mailed out a slimmed-down print version, but the online version was much more in depth.
“When the 2012 report came out, we were a little nervous,” said Cheryl Loe, communications project manager. “We weren’t positive how donors would react but we’ve been very pleased with the reception.”
Many managers’ idea of a digital annual report is simply a .pdf posted to a website. The Foundation Center’s looked like nothing it had ever before provided. Picture a wheel within a wheel. The outer wheel invited readers to “Choose an area to explore,” with sections such as: Connect; Empower; Build; Communicate; Encourage. Hovering over an area would light up sections of the inner wheel, “How we help.”
Clicking would take the readers to a new page with headings such as “Connect nonprofits to the resources they need to thrive” and “Communicate philanthropy’s contribution to making a better world,” which would show readers programmatic information. A menu at the top of each page allows users to go directly to financial information or the message from the president.
The trend of interactive, digital annual reports has been gaining steam since at least 2011, according to Scott Martin, executive vice president and chief marketing officer at Hauppauge, N.Y.-headquartered design firm Curran and Connors. “It started with a PDF version and migrated to microsites,” said Martin. “There’s a trend of (reports) becoming more rich and robust because more content is going in. There’s a lot more you can do with the content.”
Martin said his firm’s revenue from print reports has been flat this year, but revenue from digital reports is up 200 percent as of June. “Not only is it growing but the rate at which it is growing is exciting,” said Martin. He believes digital reports are a “big opportunity for a company or nonprofit to shape their message. For the average shareholder or donor, the likelihood of reading (an annual report) in print is not great. When you use multimedia, you can make it so much more engaging.”
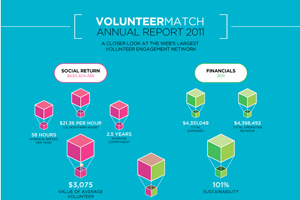
VolunteerMatch’s annual report is not just for donors and board members. It’s for the volunteers who use the site. When managers at the San Francisco-based nonprofit decided to go digital, the reasoning was, “We are a tech-based company and we wanted to be with the times and sit in with our audience,” said engagement manager Stephanie Hong.
The solution was an infographic-style report. “Not only does it save tons of paper, but it’s easy to share and easy to absorb,” Hong said. “It’s easier to see what our mission is versus being inundated with 20 pages of numbers. It’s easy to understand for our volunteers. We want them to see how they’re making a difference.”
To that end, many of the metrics on VolunteerMatch’s annual report go beyond financials. Readers will find items such as the top 10 causes on the site and the top 30 skills on users’ profiles. “It’s not just about numbers but about the people who make up our site,” said Hong.
A big advantage of a digital report on a microsite compared to a print report or even a PDF is the ability to track how many visitors go to a page, how long they stay and how far they scroll. Hong said one of the most popular sections on VolunteerMatch’s report was the statistics on the VolunteerMatch network. “People focused on that so we’re going to have a live scrolling number on the site,” she said.
“Unlike a PDF, we can see what people are looking at,” said Loe. “We can look at all those metrics on Google Analytics. Every unique project has its own URL.” She said that while Foundation Center doesn’t have enough data yet to pick out trends in report readership, analytics have allowed the organization to begin building that data set for future analysis. “I feel like we probably need more years to see if there’s a trend, but we definitely have those statistics available,” said Loe.
Search engine optimization (SEO) is a key advantage to digital reports, according to Martin. A crucial element to SEO is backlinks; the more links to and from reputable sources your website has, the better. “If you’ve got a video on your (report’s) microsite housed on YouTube, and the microsite itself, you not only get the benefit for the content but you get SEO credit from having it linked from a reputable site,” said Martin. “The same goes for other types of imagery. That helps overall visibility.”
Digital reports, especially interactive reports, have a longer tail than print or PDF reports. “Once you’ve created the content, its lifespan and vitality are greater because you can repurpose it through social media and email marketing,” said Martin. “It can help you reach a different audience, a broader audience, and help with things like visibility of the website and help it rank better on search engines.”
Loe said Foundation Center often reuses the president’s letter from the report. “We take that and reformat it as a print piece, and the development department sends it to donors on occasion,” she said. More commonly, the annual report is used and shared as a reference document. “It’s one of the nicest places you can go and quickly get a sense of everything we do in a condensed and readable format,” said Loe. “It’s a good resource if you want to show people something about the Foundation Center.”
VolunteerMatch does much the same thing, said Hong. “We love to share it as much as we can,” she said. The report crops up often on social media and in fundraising collateral. It’s also used as a recruitment tool. “Whenever we’re trying to get more nonprofits to sign up we show them the social value, how many nonprofits are in the network,” Hong said. “We probably use these numbers at least once a week.”
The cost of moving from print to digital was not much of a factor. Loe had “no comment on the price, but it’s not outrageous.” The organization has roughly the same budget for the interactive report as it did for its print report, but the costs have shifted. “We’re saving money on the print side because we’re not printing and mailing it, but some of the money has to go to back-end development,” she said. The Foundation Center works with a graphic designer to create its annual report.
Being a technology-based nonprofit, VolunteerMatch produces its report entirely in-house. “I would say this is absolutely more efficient,” said Hong. “Because everything is done in-house, approval rates are quicker and we don’t have to worry about mockups.”
Curran and Connors’ Martin said the cost varies with complexity. “There’s no such thing as typical. There is a huge range from $5,000 to as much as $100,000,” he said.
Martin thinks budget and a certain way of “this is how it’s always been done” thinking are the two biggest barriers to nonprofits’ digitizing of annual reports. “It’s about embracing change,” he said. “In the nonprofit world, the people who run organizations are typically an older demographic and might not understand the digital world well. That might make them slower to adapt.”
Budget is always a consideration. Martin said the expense is worth it. “Done properly, digital should produce a positive ROI,” he said. “If you’re doing it properly and you’re repurposing it, you should get additional engagement and SEO (search engine optimization).”
You should be able to prove a positive return with a digital report, said Martin. “When you’ve got an annual report, you can use that content. It should be developed in a way that attracts donors. If it is, you can use it for social media, articles, press releases, blog posts,” he said.
Loe said a possible consideration is that older, less tech-savvy donors might want a printed report. The Foundation Center gets around that by producing a stripped-down version with the president’s letter and bare-bones financials. “We decided we couldn’t do away entirely with the print piece because some donors really want that book to put in a file,” she said. “We identified a list of must-haves for print,” which include the letter, highlights and a donor list.
“We have that print piece very closely connected visually to online with a very large call to action to go online,” she said. “We want people to explore online because that’s where the descriptions of the projects are, and they’re able to interact” with the rest of the report.
Hong said she couldn’t think of any downsides to going completely digital, other than possibly inconveniencing some of an organization’s older donors. “But everyone is on the Internet, especially in the nonprofit world,” she said. “There are way more ups than downs.”